IoT platform that "visualizes" any environment
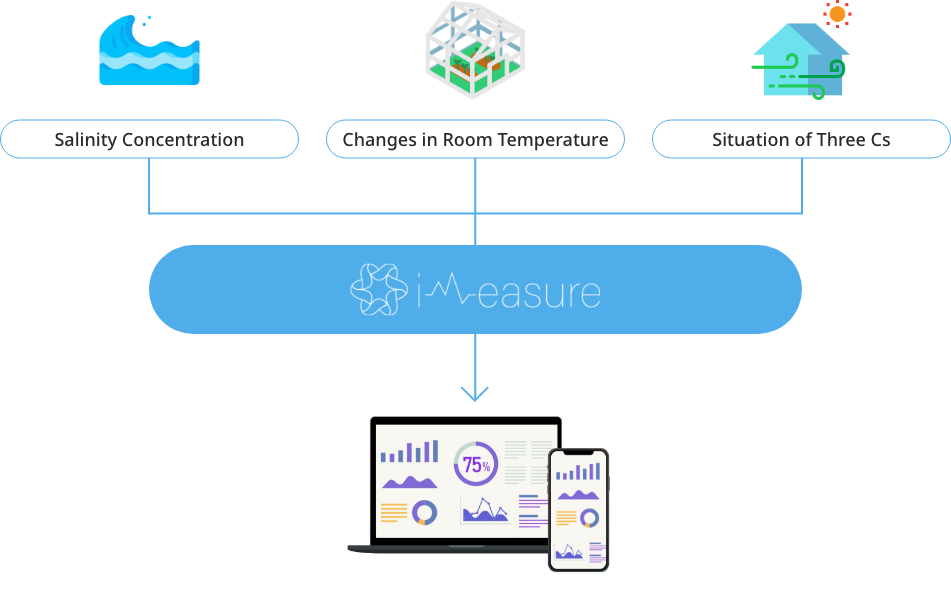
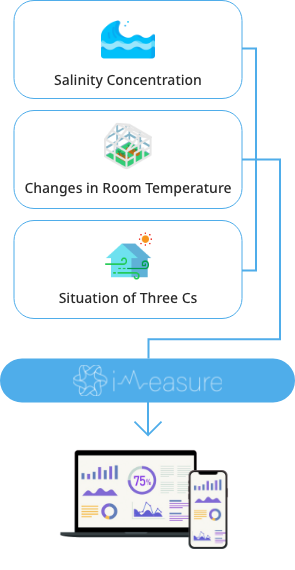
It is an IoT platform that displays data acquired by various sensors on a web browser and realizes "visualization" of any environment. You can customize the sensor to suit the environment you want to measure and display it on a variety of devices.
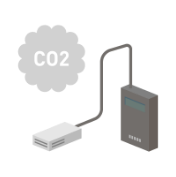
carbon
dioxide
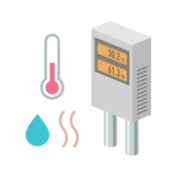
Humidity
and temperature
Temperature
and sunshine
Customize sensors for your environment
In fields such as agriculture, manufacturing, transportation, services, fisheries, and sports, the numerical values you want to measure are different. If you wish to use a sensor other than the sensor that is standard on the IoT platform, we will consider the shape of the IoT device according to the installation environment, power supply method, weather resistance, etc., and respond from PoC (proof of concept) development.
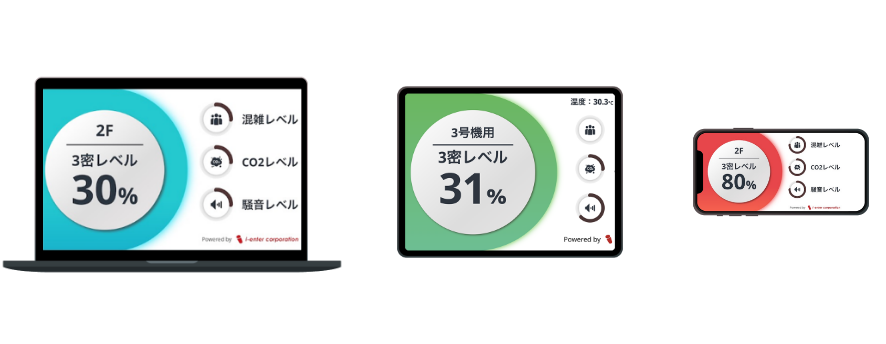
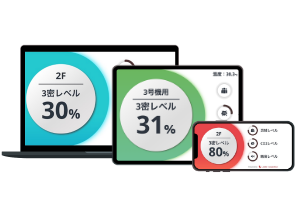
Realization of "visualization" on various devices
IoT platforms store and store data acquired from sensors in the cloud. Therefore, "visualization" can be realized on various devices such as PCs, tablets, smartphones, and in-store monitors. In addition, it is also possible to create a separate screen design according to the desired device.
i-Measure for CO2
Alert by visualizing invisible carbon dioxide concentrations
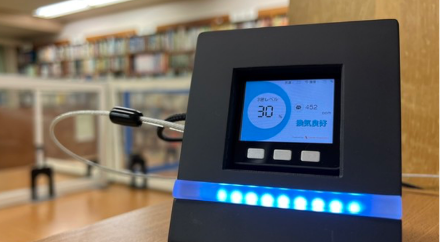
In order to provide a better living environment adapted to the new normal society, we provide psychological safety to customers and employees by combining CO2 sensors and i-Measure to measure and notify the CO2 concentration (ppm) in the room.
i-Measure for 3Cs
Numerical understanding of human flow and noise and visualization of the three density levels
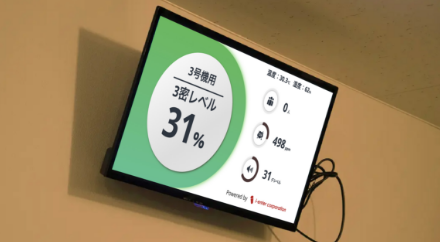
In addition to CO2 sensors, the environment and the flow of people throughout the room are grasped numerically from image recognition by cameras and various sensors, and after analysis, the three density levels, humidity, temperature, noise degree, carbon dioxide concentration, and population density are notified.
Introduction Flow
- Step.1
 Contact Image
First of all, please feel free to contact us.
- Step.2
 Hearing
We will conduct a hearing about the installation environment.
- Step.3
 i-Measure Design
We design the optimal system configuration for your environment.
- Step.4
 On-site installation
Install sensors and other devices in the field and check for cloud-related connections.
- Step.5
 Get Started
We will support you carefully even after the start of use. Don't worry.
It can be handled anywhere in Japan.
First of all, please feel free to contact us.